Using Data Visualization Tools, dive into a world where complex data transforms into compelling visuals that drive impactful decision-making and communication across diverse industries. Discover how these tools revolutionize the way insights are shared and understood.
From interactive charts to dynamic maps, explore the power of data visualization tools in unlocking hidden patterns and trends that shape our understanding of complex datasets.
Introduction to Data Visualization Tools: Using Data Visualization Tools

Data visualization plays a crucial role in decision-making processes by transforming complex data into easily understandable visuals. These tools help individuals and organizations make informed decisions based on data-driven insights.
Popular Data Visualization Tools
Various industries rely on different data visualization tools to analyze and present data effectively. Some popular tools include:
- Tableau: Known for its interactive dashboards and user-friendly interface, Tableau is widely used for data visualization in business intelligence.
- Microsoft Power BI: An integrated tool that allows users to create reports, dashboards, and visualizations to gain insights from data.
- Google Data Studio: This free tool enables users to create customizable reports and dashboards by connecting to various data sources.
Benefits of Using Data Visualization Tools
Using data visualization tools offers numerous benefits for effectively communicating insights:
- Improved Decision Making: Visual representations of data help users identify patterns, trends, and outliers more easily, leading to better decision-making.
- Enhanced Storytelling: Visualizations make it easier to convey complex information in a compelling and engaging way, enhancing communication and understanding.
- Increased Accessibility: Visualizations make data more accessible to a wider audience, regardless of their technical expertise, fostering collaboration and knowledge-sharing.
Types of Data Visualization Tools

Data visualization tools come in various categories, each serving a specific purpose in making data more understandable and actionable. Let’s explore some of the main types of data visualization tools and their features.
Charts
Charts are one of the most common types of data visualization tools. They represent data in a visual format through different types of charts such as bar charts, pie charts, line charts, and scatter plots. Each type of chart has its unique way of displaying data, making it easier to identify trends, patterns, and relationships within the data.
Graphs
Graphs are another essential type of data visualization tool that uses nodes and edges to represent data relationships. Examples of graphs include network graphs, tree diagrams, and flowcharts. Graphs are particularly useful for visualizing complex relationships and hierarchies within datasets.
Maps
Maps are powerful data visualization tools that display data geographically. They can be used to represent various data points on a map, providing insights into spatial patterns and relationships. Examples of map-based visualization tools include GIS software, heat maps, and choropleth maps.
Infographics
Infographics combine text, visuals, and data to convey information in a concise and engaging manner. They are often used to present complex data in a more digestible format, making it easier for the audience to understand key insights at a glance.
Dashboards
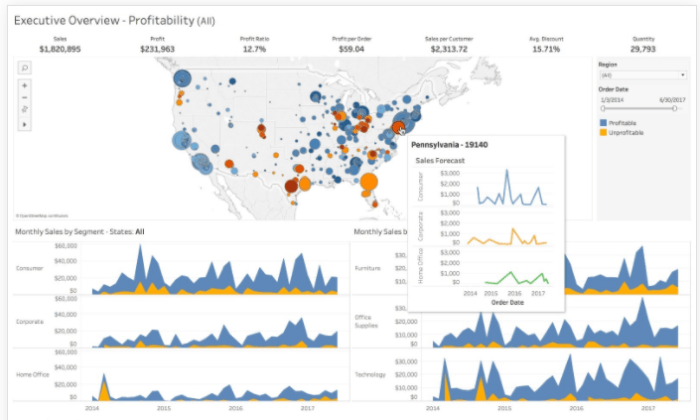
Dashboards are interactive data visualization tools that allow users to monitor key metrics and KPIs in real-time. They typically consist of multiple visualizations such as charts, graphs, and tables, enabling users to track performance, identify trends, and make data-driven decisions.
These are just a few examples of the types of data visualization tools available, each with its unique features and functionalities to help users gain valuable insights from their data.
Best Practices for Using Data Visualization Tools
When it comes to using data visualization tools, there are certain best practices that can help you make the most out of your data. From selecting the right tool to creating visually appealing visualizations, these practices can ensure that your data is accurately represented and easily understood.
Key Considerations for Selecting the Right Data Visualization Tool
- Understand the type of data you have: Consider whether your data is categorical, numerical, temporal, or spatial, and choose a tool that best supports the visualization of that type of data.
- Consider your audience: Think about who will be viewing your visualizations and what level of detail and complexity they can understand. Choose a tool that caters to your audience’s needs.
- Evaluate features and functionalities: Look for tools that offer the specific features you need, such as interactivity, customization options, and compatibility with different data formats.
Techniques for Creating Visually Appealing and Informative Data Visualizations, Using Data Visualization Tools
- Use appropriate chart types: Select the right type of chart or graph that effectively communicates the relationship between your data points. Avoid using overly complex or irrelevant visualizations.
- Pay attention to design elements: Consider color schemes, font sizes, and layout to create visualizations that are visually appealing and easy to interpret. Keep the design clean and uncluttered.
- Provide context and annotations: Add labels, titles, and annotations to explain the data and provide context for the visualizations. This helps viewers understand the information presented.
Tips for Ensuring Data Accuracy and Integrity
- Verify data sources: Ensure that the data you are using is accurate, up-to-date, and from reliable sources. Check for any errors or inconsistencies in the data before visualizing it.
- Double-check calculations: Make sure that any calculations or transformations applied to the data are accurate and correctly represented in the visualizations. Avoid misleading or incorrect visualizations due to calculation errors.
- Keep data updated: Regularly update your data visualizations with new data to ensure that the information remains relevant and reflects the most current trends and insights.
Challenges and Limitations of Data Visualization Tools
Data visualization tools offer a powerful way to make sense of large datasets and communicate insights effectively. However, they also come with their own set of challenges and limitations that users need to be aware of in order to maximize their effectiveness.
Common Challenges Faced with Data Visualization Tools
- Complexity of Data: One of the main challenges faced when working with data visualization tools is the complexity of the data being analyzed. Large datasets with multiple variables can be difficult to represent visually in a clear and concise manner.
- Choosing the Right Visualization: Another challenge is selecting the most appropriate type of visualization for the data at hand. Different types of data require different visual representations, and choosing the wrong one can lead to misinterpretation.
- Data Quality Issues: Data visualization tools rely on the quality of the underlying data. Inaccurate or incomplete data can lead to misleading visualizations, impacting the decision-making process.
Limitations of Data Visualization Tools
- Scalability: Some data visualization tools may struggle to handle large and complex datasets, leading to performance issues and limitations in the amount of data that can be effectively visualized.
- Interactivity: Not all data visualization tools offer the same level of interactivity. Some tools may have limitations in terms of user interaction and the ability to drill down into specific data points for deeper analysis.
- Compatibility: Data visualization tools may have limitations in terms of compatibility with different data sources and formats. This can pose challenges when trying to integrate data from multiple sources into a single visualization.
Strategies for Overcoming Challenges: To overcome these challenges and maximize the effectiveness of data visualization tools, users should focus on improving data quality, conducting thorough data analysis before visualization, and investing time in learning how to use the tools effectively.


